
A wear part with a higher purchase price can still be the lower-cost choice, while a longer campaign can still be a poor result if it reduces throughput or ends in unplanned downtime. That is why service hours alone are not enough for comparing crusher hammers, liners or blow bars.
The most useful starting metric is component cost per verified tonne processed. It becomes a decision tool only when the parts, operating window and calculation basis are recorded consistently.
Define the campaign before calculating anything
Set the start and end boundaries first. A campaign record should identify:
- machine, line and crusher position;
- installed part numbers and material route;
- number of parts installed and number measured;
- installation and removal dates;
- new and removed weights, where practical;
- processed tonnes from an agreed production record;
- operating hours and stoppages;
- feed, setting and throughput changes;
- abnormal events or partial replacements;
- delivered part cost and the currency basis.
If parts were rotated, reversed or replaced individually during the period, record those events. A calculation that assumes one unchanged set will otherwise assign production to the wrong component mass.
Calculate mass wear rate on a stated basis
For a set of measured parts:
Total mass loss (kg) = sum of new mass minus removed mass for each measured part
Mass wear rate (g/t) = total mass loss (kg) × 1,000 ÷ verified production (t)
Example: if the measured set loses 2,000 kg during a period that processes 500,000 t, the recorded mass wear rate is 4 g/t. This is a calculation example, not a performance benchmark. A different crusher, feed, part set or measurement scope should not be judged against it without context.
State whether the result represents every installed part or only a sample. If only some parts were weighed, do not scale the result to the full set unless the sampling method and wear distribution justify it.
Calculate component cost per tonne consistently
At its simplest:
Component cost per tonne = delivered component cost consumed in the campaign ÷ verified production
Use the same cost basis for every candidate. Decide whether “delivered component cost” includes freight, duty, insurance and local handling. Do not compare an ex-works price for one supplier with a delivered price for another.
When only part of a set is consumed, define how the remaining value is treated. The cleanest comparison usually closes when the measured set reaches an agreed removal point. If a campaign is still running, label the calculation as interim.
Add the costs that purchase price misses
Component cost per tonne is useful, but total operating impact can include:
- planned and unplanned change-out labour;
- crane, tooling and contractor time;
- lost production during replacement;
- damage to seats, rotors, housings or adjacent liners;
- throughput or product-shape changes as the profile wears;
- inventory and emergency freight;
- inspection and disposal costs.
These values may not be available with the same confidence as part price and production. Keep measured values separate from estimates, state the assumptions, and avoid forcing every effect into one number when the evidence is weak.
Compare campaigns only after checking comparability
Use a review table before declaring a winner:
| Comparison factor | Campaign A | Campaign B | Comparable? |
|---|---|---|---|
| Machine and chamber | Record | Record | Yes / No |
| Part geometry and usable profile | Record | Record | Yes / No |
| Feed and top size | Record | Record | Yes / No |
| Setting and throughput | Record | Record | Yes / No |
| Installed quantity | Record | Record | Yes / No |
| Material and inspection scope | Record | Record | Yes / No |
| Abnormal events | Record | Record | Yes / No |
| Production data source | Record | Record | Yes / No |
If several conditions changed, the records can still describe field performance, but they do not isolate the effect of material. The conclusion should say that clearly.
Use wear profile and failure mode with the numbers
Two parts can produce a similar cost per tonne and reach removal for different reasons. One may lose mass evenly; another may crack, flatten, loosen or damage a seat before its material is consumed.
Attach:
- before-and-after photographs from consistent angles;
- removed weights or controlled dimensions;
- photographs of seating and retaining interfaces;
- crack or insert-loss locations;
- the reason for removal;
- remaining usable profile, if the part was removed early.
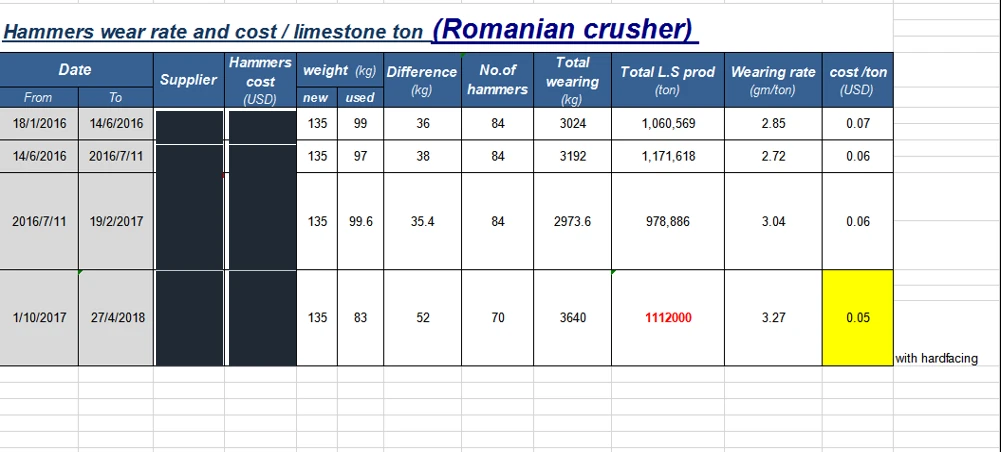
For crusher hammer heads, record how many hammers were installed, their new and removed weights, whether hardfacing or inserts were present, and whether the complete set remained in service for the same period.
Read field records as evidence, not universal promises
ZL publishes redacted hammer worksheets and customer correspondence to show the type of evidence available in specific recorded campaigns. The disclosed tonnage, wear rate and cost figures belong to those operating records. They should not be presented as guaranteed results for another crusher or material route.
For a worked example, see the Romanian crusher hammer field test, which recalculates four recorded campaigns and separates supported findings from unresolved operating variables.
The transferable value is the method: identify the set, define the campaign, measure consumption, verify production, record changes and calculate on a consistent cost basis.
Build the next trial around a decision rule
Before ordering a trial set, agree what success means. It may be lower component cost per tonne, reduced breakage risk, a longer planned change interval, more stable throughput or fewer emergency replacements. Record the baseline using the same method that will be applied to the trial.
To review an existing campaign, send the part identity, new and removed weights, installed quantity, production record, dates, cost basis, wear photographs and operating changes through the quotation form.