
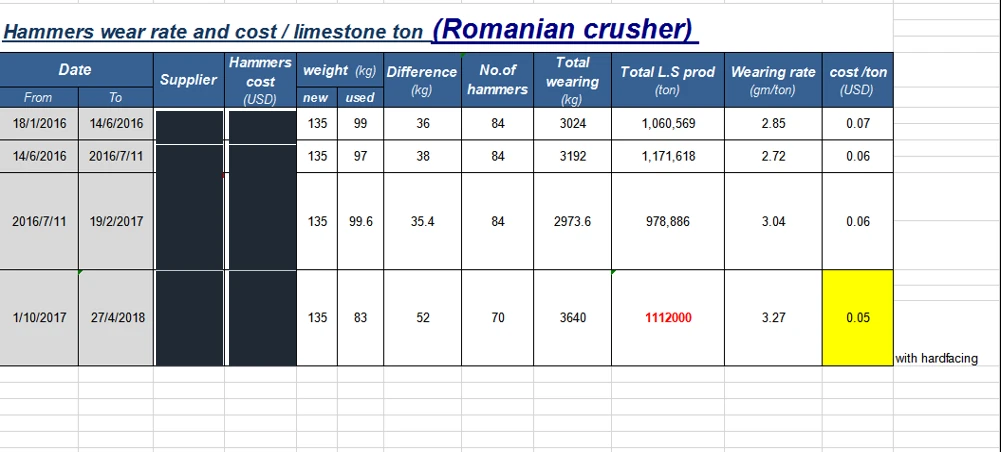
This case note analyses one customer-supplied worksheet covering four limestone crusher hammer campaigns in Romania. ZL supplied the two Chinese-origin campaigns discussed below, so this is supplier-published evidence, not an independent test. The customer recorded the operating figures; our contribution is the transcription, arithmetic and interpretation.
The central result is mixed rather than promotional: the standard ZL campaign recorded about 9.1% higher mass wear than the aggregated European benchmark, while its displayed component cost per tonne matched the lower of the two European rows. The later hardfaced ZL row showed the highest mass wear rate and the lowest displayed component cost per tonne. Because the worksheet does not document several operating variables, these figures describe four field campaigns; they do not isolate material performance under controlled conditions.
The source supports a four-campaign comparison, not a 16-month test
The worksheet records campaign dates from January 2016 to April 2018, including a gap between the third and fourth campaigns. It identifies a Romanian limestone crusher, 135 kg new hammer weight and the values shown below. It does not identify the crusher model, rated throughput, feed gradation, silica content, operating hours or a common removal criterion.
Supplier names and set prices are removed from the public worksheet image. “European benchmark” and “ZL” below identify the comparison groups without disclosing the other supplier.
| Campaign | Recorded dates | Source | Hammers | New mass per hammer | Removed mass per hammer | Total mass loss | Processed limestone | Reported wear | Reported component cost |
|---|---|---|---|---|---|---|---|---|---|
| 1 | 18 Jan–14 Jun 2016 | European benchmark | 84 | 135 kg | 99 kg | 3,024 kg | 1,060,569 t | 2.85 g/t | USD 0.07/t |
| 2 | 14 Jun–11 Jul 2016 | European benchmark | 84 | 135 kg | 97 kg | 3,192 kg | 1,171,618 t | 2.72 g/t | USD 0.06/t |
| 3 | 11 Jul 2016–19 Feb 2017 | ZL standard | 84 | 135 kg | 99.6 kg | 2,973.6 kg | 978,886 t | 3.04 g/t | USD 0.06/t |
| 4 | 1 Oct 2017–27 Apr 2018 | ZL hardfaced | 70 | 135 kg | 83 kg | 3,640 kg | 1,112,000 t | 3.27 g/t | USD 0.05/t |
The cost figures are the worksheet’s rounded values. The public record does not disclose whether they include freight, duty, installation labour or downtime, so this article treats them as recorded component cost per tonne, not total operating cost.
Recalculation confirms the wear figures but narrows the conclusion
For the two European rows, an aggregated benchmark is more defensible than a simple average because the campaigns processed different tonnages:
European aggregated wear = (3,024 + 3,192) kg × 1,000 ÷ (1,060,569 + 1,171,618) t = 2.785 g/t
For the standard ZL campaign:
ZL standard wear = 2,973.6 kg × 1,000 ÷ 978,886 t = 3.038 g/t
On that basis, the standard ZL row recorded approximately 9.1% more mass loss per processed tonne than the aggregated European rows. This calculation is slightly different from dividing the two displayed two-decimal rates because it uses the underlying mass and tonnage values.
The worksheet displays USD 0.06/t for the standard ZL row, USD 0.06/t for one European row and USD 0.07/t for the other. Those values support “comparable to the lower European row,” but they do not support a precise percentage saving: when figures are rounded to USD 0.01/t and the underlying set prices are not public, a percentage calculated from the displayed values would imply more precision than the source provides.
For the hardfaced ZL campaign, the underlying mass and tonnage produce 3.273 g/t. That is about 7.8% above the standard ZL campaign on the same calculation basis. It also has the lowest displayed component cost, USD 0.05/t. This is an observed combination, not proof that hardfacing caused either result.
The worksheet leaves six important variables unresolved
The record is useful because it contains installed quantity, new and removed mass, processed tonnage and component cost per tonne. It is incomplete as a controlled supplier comparison for six reasons:
- Operating conditions are not documented. Feed size, moisture, mineralogy, crusher setting, rotor speed and throughput can change wear.
- The second campaign needs date verification. Its recorded 1,171,618 t over 27 calendar days would average more than 43,000 t per calendar day. The worksheet may use a partial date window, a different production boundary or another convention that is not stated.
- The fourth campaign used 70 hammers instead of 84. The record does not explain whether the rotor configuration, hammer positions or accounting method changed.
- Operating hours and downtime are absent. Component cost per tonne therefore cannot be converted into total maintenance or lost-production cost.
- Removal and failure criteria are absent. The worksheet does not say whether every hammer reached the same profile limit, whether parts were rotated, or whether any part was removed early.
- Batch and metallurgy records are absent. Heat numbers, chemical results, hardness maps, heat-treatment records and hardfacing procedure details are not attached.
These gaps also limit metallurgical interpretation. ASTM A532/A532M provides classifications and property requirements for abrasion-resistant cast irons, but compliance with a material class is not a service-life guarantee. For hardfacing, Hobart’s technical guidance stresses matching the filler metal to the actual wear mechanism. Without base-material records, filler classification, welding procedure, wear photographs and failure analysis, this worksheet cannot identify why the hardfaced row wore at a different rate.
The field record supports three findings
| Finding supported by the worksheet | Evidence boundary |
|---|---|
| The standard ZL campaign recorded about 9.1% higher mass wear than the aggregated European benchmark. | Derived from the recorded mass loss and tonnage; not a controlled same-condition result. |
| The standard ZL row displayed USD 0.06/t, equal to the lower European row and below the other row. | Based on rounded component-cost figures; a precise saving percentage is not defensible from the public values. |
| The hardfaced ZL row recorded 3.27 g/t and displayed USD 0.05/t. | Lowest displayed component cost and highest recorded wear among these four rows; causation is not established. |
The record does not prove that one country of origin, foundry or material route will always outperform another. Its strongest value is practical: it shows why buyers should evaluate wear rate and cost per tonne together while recording the conditions that could change both.
Use the same method with stricter trial controls
Before installing a trial set, define the decision rule and the evidence that will be collected. A useful trial record should include:
- crusher, rotor position and part drawing or part number;
- supplier, heat or batch identity and material route;
- installed quantity, new mass and agreed removal limit;
- feed description, throughput, settings and material changes;
- operating hours, processed tonnes and the production-data source;
- rotations, partial replacements, breakage and abnormal stoppages;
- removed mass, wear-profile photographs and reason for removal;
- delivered component cost, change-out cost and lost-production assumptions.
Use plant-specific acceptance criteria rather than a universal percentage threshold. One operation may prioritise the lowest component cost per tonne; another may accept a higher part price to protect a planned maintenance interval or reduce breakage risk. Our crusher wear cost-per-tonne guide explains how to keep the calculation basis consistent.
Data provenance and editorial disclosure
ZL received the customer worksheet in 2018. The public image removes supplier-identifying and commercial price information. The campaign values needed for this analysis are transcribed above; the 2.785 g/t, 3.038 g/t, 9.1% and 7.8% figures are calculations derived from the recorded mass and tonnage values.
ZL did not collect the plant’s original production data and has not independently audited the source records. We therefore present this as a field record with stated limitations, not as a laboratory test, guaranteed service-life claim or universal supplier ranking.